Note
Go to the end to download the full example code
Topographic shading
Add topographic shading to a plot
from salem import mercator_grid, Map, get_demo_file
import matplotlib.pyplot as plt
# prepare the figure
f, ((ax1, ax2), (ax3, ax4)) = plt.subplots(2, 2, figsize=(8, 7))
# map extent
grid = mercator_grid(center_ll=(10.76, 46.79), extent=(18000, 14000))
sm = Map(grid, countries=False)
sm.set_lonlat_contours(interval=0)
sm.set_scale_bar()
# add topography
fpath = get_demo_file('hef_srtm.tif')
sm.set_topography(fpath)
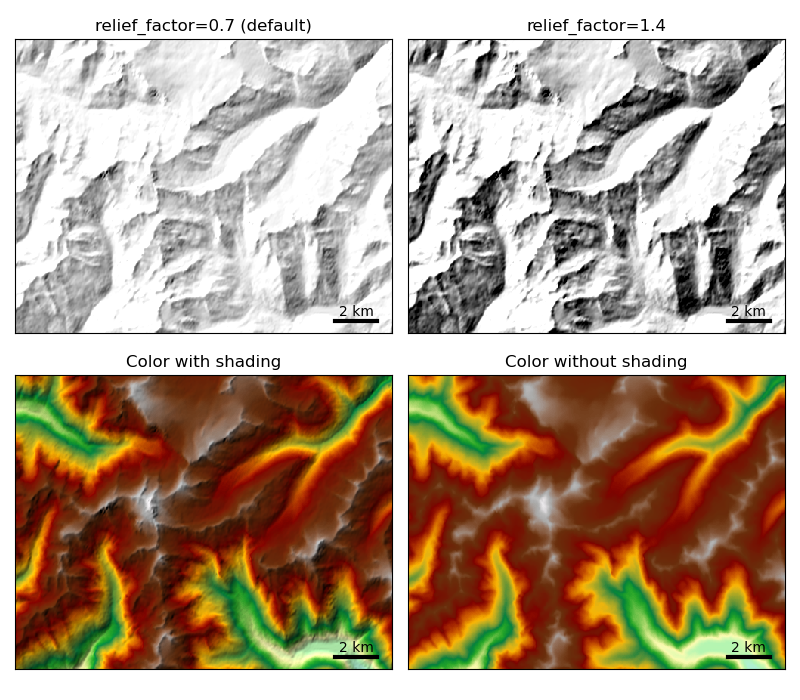
sm.visualize(ax=ax1, addcbar=False, title='relief_factor=0.7 (default)')
# stronger shading
sm.set_topography(fpath, relief_factor=1.4)
sm.visualize(ax=ax2, addcbar=False, title='relief_factor=1.4')
# add color shading
z = sm.set_topography(fpath)
sm.set_data(z)
sm.set_cmap('topo')
sm.visualize(ax=ax3, title='Color with shading', addcbar=False)
# color without topo shading
sm.set_topography()
sm.visualize(ax=ax4, title='Color without shading', addcbar=False)
# make it nice
plt.tight_layout()
plt.show()
Total running time of the script: (0 minutes 1.011 seconds)