Note
Go to the end to download the full example code
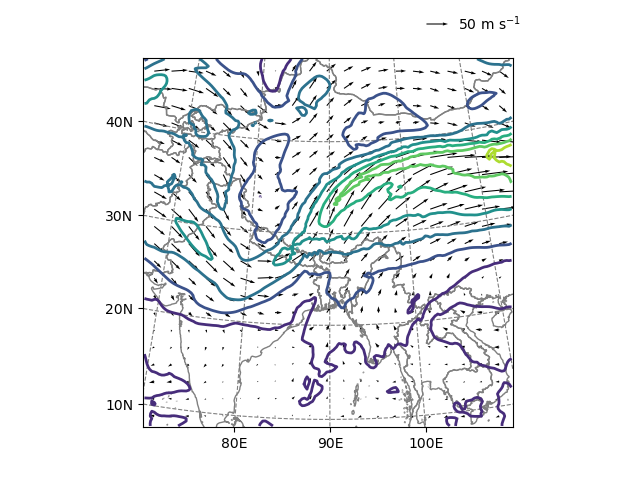
Plot overlays
Add contours and wind arrows to a salem plot
import salem
import numpy as np
import matplotlib.pyplot as plt

# get the data at the latest time step
ds = salem.open_wrf_dataset(salem.get_demo_file('wrfout_d01.nc')).isel(time=-1)

# get the wind data at 10000 m a.s.l.
u = ds.salem.wrf_zlevel('U', 10000.)
v = ds.salem.wrf_zlevel('V', 10000.)
ws = ds.salem.wrf_zlevel('WS', 10000.)

# get the axes ready
f, ax = plt.subplots()

# plot the salem map background, make countries in grey
smap = ds.salem.get_map(countries=False)
smap.set_shapefile(countries=True, color='grey')
smap.plot(ax=ax)

# transform the coordinates to the map reference system and contour the data
xx, yy = smap.grid.transform(ws.west_east.values, ws.south_north.values,
                             crs=ws.salem.grid.proj)
cs = ax.contour(xx, yy, ws, cmap='viridis', levels=np.arange(0, 81, 10),
                linewidths=2)

# Quiver only every 7th grid point
u = u[4::7, 4::7]
v = v[4::7, 4::7]

# transform their coordinates to the map reference system and plot the arrows
xx, yy = smap.grid.transform(u.west_east.values, u.south_north.values,
                             crs=u.salem.grid.proj)
xx, yy = np.meshgrid(xx, yy)
qu = ax.quiver(xx, yy, u.values, v.values)
qk = plt.quiverkey(qu, 0.7, 0.95, 50, '50 m s$^{-1}$',
                   labelpos='E', coordinates='figure')

# done!
plt.show()
Total running time of the script: (0 minutes 5.752 seconds)