Note
Go to the end to download the full example code.
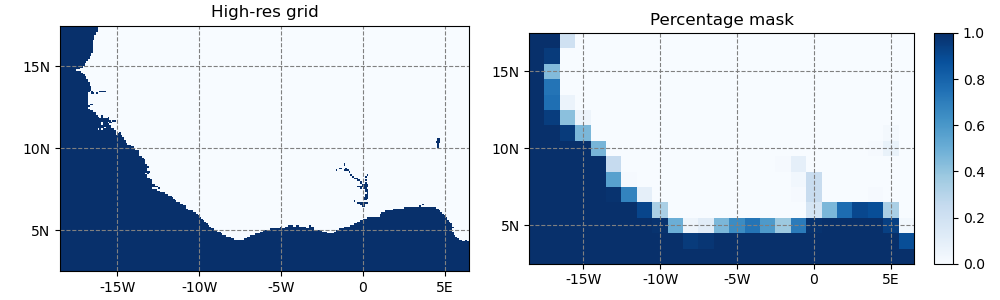
Shape to raster – subgrid
Compute a percentage raster from a shapefile.
This example extends the land/sea shape to raster example with a subgrid land cover mask.
import salem
import matplotlib.pyplot as plt

# make a local grid from which we will compute the mask
# we make it coarse so that we see the grid points
grid = salem.Grid(proj=salem.wgs84, x0y0=(-18, 3), nxny=(25, 15), dxdy=(1, 1))

# make a high-res subgrid grid to compute the mask
hr_grid = grid.regrid(factor=10)

# read the ocean shapefile (data from http://www.naturalearthdata.com)
oceans = salem.read_shapefile(salem.get_demo_file('ne_50m_ocean.shp'),
                              cached=True)

# read the lake shapefile (data from http://www.naturalearthdata.com)
lakes = salem.read_shapefile(salem.get_demo_file('ne_50m_lakes.shp'),
                              cached=True)

# Now compute the hr mask
hr_mask  = hr_grid.region_of_interest(shape=oceans)
hr_mask = hr_grid.region_of_interest(shape=lakes, roi=hr_mask)

# And reduce it to the original grid
perc_mask = salem.reduce(hr_mask, factor=10)

# Make a map to check our results
sm = salem.Map(grid, countries=False)
sm.set_plot_params(cmap='Blues', vmax=1)

# prepare the figure
f, (ax1, ax2) = plt.subplots(1, 2, figsize=(10, 3))

# plot 1
sm.set_data(hr_mask, hr_grid)
sm.visualize(ax=ax1, addcbar=False, title='High-res grid')
# plot 2
sm.set_data(perc_mask)
sm.visualize(ax=ax2, addcbar=True, title='Percentage mask')

# plot!
plt.tight_layout()
plt.show()
Total running time of the script: (0 minutes 5.565 seconds)