xarray accessors
One of the main purposes of Salem is to add georeferencing tools to
`xarray`_ ‘s data structures. These tools can be accessed via a special
.salem attribute, available for both xarray.DataArray and
xarray.Dataset objects after a simple import salem in your code.
Initializing the accessor
Automated projection parsing
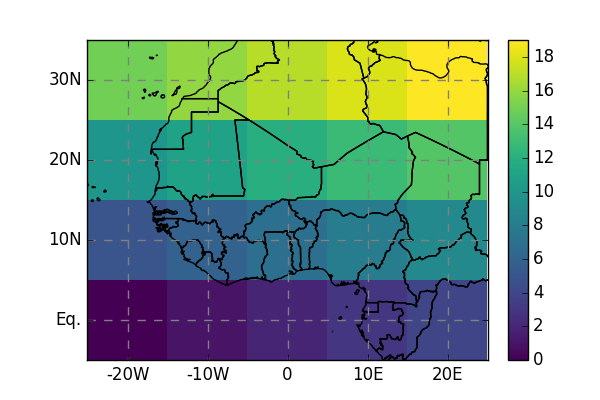
Salem will try to understand in which projection the Dataset or DataArray is defined. For example, with a platte carree (or lon/lat) projection, Salem will know what to do based on the coordinates’ names:
In [1]: import numpy as np

In [2]: import xarray as xr

In [3]: import salem

In [4]: da = xr.DataArray(np.arange(20).reshape(4, 5), dims=['lat', 'lon'],
   ...:                   coords={'lat':np.linspace(0, 30, 4), 'lon':np.linspace(-20, 20, 5)})
   ...:

In [5]: da.salem
Out[5]: <salem.sio.DataArrayAccessor at 0x7f0e5d82c390>

In [6]: da.salem.quick_map();
While the above should work with many (most?) climate datasets (such as atmospheric reanalyses or GCM output), certain NetCDF files will have a less standard map projection requiring special parsing. There are conventions to formalise these things in the NetCDF model, but Salem doesn’t understand them yet. Currently, Salem can parse: - platte carree (or lon/lat) projections - WRF projections (see WRF tools) - virually any projection explicitly provided by the user - for geotiff files only: any projection that rasterio can understand
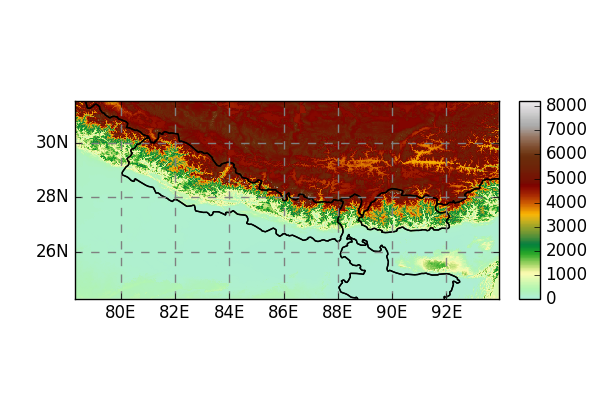
From geotiffs
Salem uses rasterio to open and parse geotiff files:
In [7]: fpath = salem.get_demo_file('himalaya.tif')

In [8]: ds = salem.open_xr_dataset(fpath)

In [9]: hmap = ds.salem.get_map(cmap='topo')

In [10]: hmap.set_data(ds['data'])

In [11]: hmap.visualize();
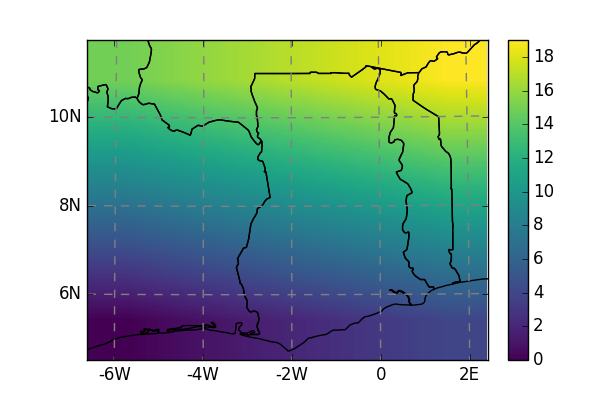
Custom projections
Alternatively, Salem will understand any projection supported by pyproj. The proj info has to be provided as attribute:
In [12]: dutm = xr.DataArray(np.arange(20).reshape(4, 5), dims=['y', 'x'],
   ....:                     coords={'y': np.arange(3, 7)*2e5,
   ....:                             'x': np.arange(1, 6)*2e5})
   ....:

In [13]: psrs = 'epsg:32630'  # http://spatialreference.org/ref/epsg/wgs-84-utm-zone-30n/

In [14]: dutm.attrs['pyproj_srs'] = psrs

In [15]: dutm.salem.quick_map(interp='linear');