Georeferencing
A point on earth can be defined unambiguously in two ways:
- DATUM (lon, lat, datum)
- longitudes and latitudes are angular coordinates of a point on an ellipsoid (datum)
- PROJ (x, y, projection)
- x (eastings) and y (northings) are cartesian coordinates of a point in a map projection (the unit of x, y is usually meter)
Salem adds a third coordinate reference system (crs) to this list:
- GRID (i, j, Grid)
- on a structured grid, the (x, y) coordinates are distant of a constant (dx, dy) step. The (x, y) coordinates are therefore equivalent to a new reference frame (i, j) proportional to the projection’s (x, y) frame.
Transformations between datums and projections is handled by several tools in the python ecosystem, for example GDAL or the more lightweight pyproj, which is the tool Salem is using internally [1].
The concept of Grid added by Salem is useful when transforming data between two structured datasets, or from an unstructured dataset to a structured one.
| [1] | Most datasets nowadays are defined in the WGS 84 datum, therefore the concepts of datum and projection are often interchangeable: (lon, lat) coordinates are equivalent to cartesian (x, y) coordinates in the plate carree projection. |
Grids
A Grid is defined by a projection, a reference point in
this projection, a grid spacing and a number of grid points:
In [1]: import numpy as np

In [2]: import salem

In [3]: from salem import wgs84

In [4]: grid = salem.Grid(nxny=(3, 2), dxdy=(1, 1), ll_corner=(0.5, 0.5), proj=wgs84)

In [5]: x, y = grid.xy_coordinates

In [6]: x
Out[6]:
array([[ 0.5,  1.5,  2.5],
       [ 0.5,  1.5,  2.5]])

In [7]: y
Out[7]:
array([[ 0.5,  0.5,  0.5],
       [ 1.5,  1.5,  1.5]])
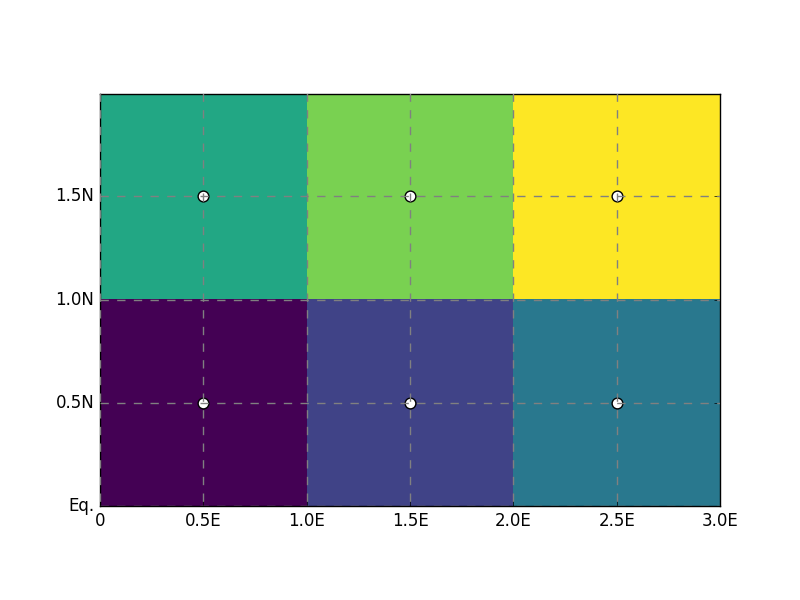
The default in Salem is to define the grids according to the pixels center point:
In [8]: smap = salem.Map(grid)

In [9]: smap.set_data(np.arange(6).reshape((2, 3)))

In [10]: lon, lat = grid.ll_coordinates

In [11]: smap.set_points(lon.flatten(), lat.flatten())

In [12]: smap.visualize(addcbar=False)
But with the pixel_ref keyword you can use another convention. For Salem,
the two conventions are identical:
In [13]: grid_c = salem.Grid(nxny=(3, 2), dxdy=(1, 1), ll_corner=(0, 0),
   ....:                     proj=wgs84, pixel_ref='corner')
   ....:

In [14]: assert grid_c == grid
While it’s good to know how grids work, most of the time grids should be inferred directly from the data files:
In [15]: ds = salem.open_xr_dataset(salem.get_demo_file('himalaya.tif'))

In [16]: grid = ds.salem.grid

In [17]: grid.proj.srs
Out[17]: '+units=m +init=epsg:4326 '

In [18]: grid.extent
Out[18]:
[78.312513473116013,
 93.937514288103202,
 24.237496572347762,
 31.545830286884001]
Grids come with several convenience functions, for example for transforming a point onto the grid coordinates:
In [19]: grid.transform(85, 27, crs=salem.wgs84)
Out[19]: (801.99834136842378, 544.9996059728029)
Or for reprojecting structured data (the xarray accessors
transform() method calls
map_gridded_data() internally):
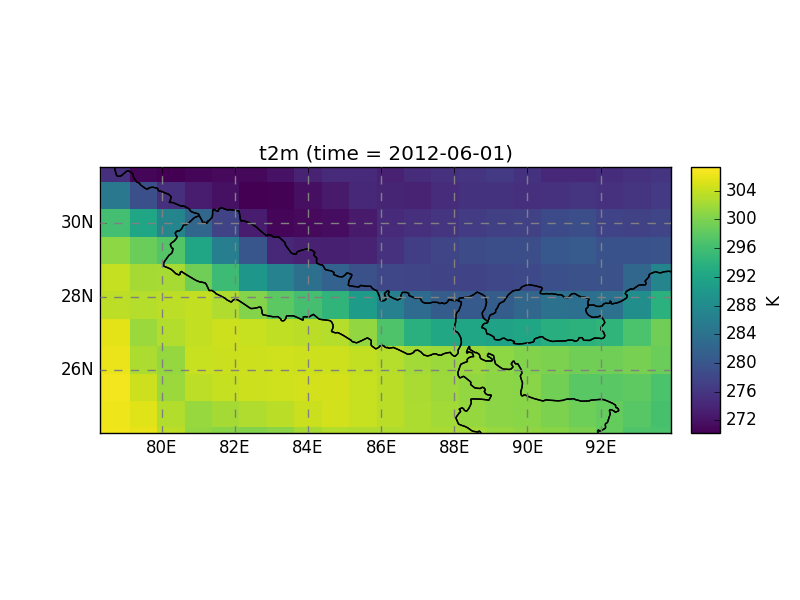
In [20]: dse = salem.open_xr_dataset(salem.get_demo_file('era_interim_tibet.nc'))

In [21]: t2_era_reproj = ds.salem.transform(dse.t2m.isel(time=0))

In [22]: t2_era_reproj.salem.quick_map()
Out[22]: <salem.graphics.Map at 0x7fd3b2c22850>