Note
Click here to download the full example code
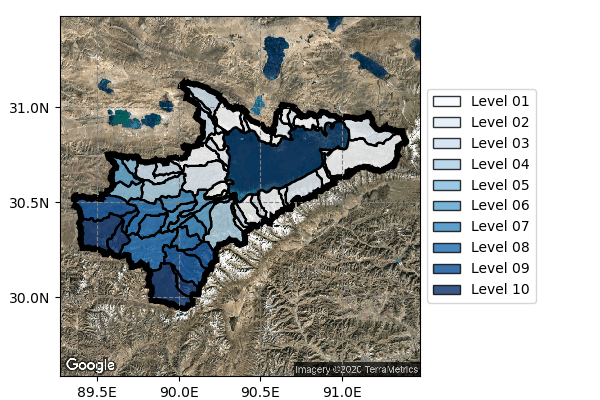
Plotting shapefiles
Put some colors and labels on shapefiles
In this script, we use data from the HydroSHEDS database to illustrate some functionalities of salem Maps. The data shows the sub-basins of the Nam Co Lake catchment in Tibet. We navigate between the various tributary catchments of the lake.
import salem
import matplotlib.pyplot as plt

# read the shapefile
shpf = salem.get_demo_file('Lev_09_MAIN_BAS_4099000881.shp')
gdf = salem.read_shapefile(shpf)

# Get the google map which encompasses all geometries
g = salem.GoogleVisibleMap(x=[gdf.min_x.min(), gdf.max_x.max()],
                           y=[gdf.min_y.min(), gdf.max_y.max()],
                           maptype='satellite', scale=2,
                           size_x=400, size_y=400)
ggl_img = g.get_vardata()

# Get each level draining into the lake, then into the last level, and so on
gds = []
prev_id = [gdf.iloc[0].MAIN_BAS]
while True:
    gd = gdf.loc[gdf.NEXT_DOWN.isin(prev_id)]
    if len(gd) == 0:
        break
    gds.append(gd)
    prev_id = gd.HYBAS_ID.unique()

# make a map of the same size as the image
sm = salem.Map(g.grid, factor=1)
sm.set_rgb(ggl_img)  # add the background rgb image
# add all the draining basins
cmap = plt.get_cmap('Blues')
for i, gd in enumerate(gds):
    # here we use a trick. set_shapefile uses PatchCollections internally,
    # which is fast but does not support legend labels.
    # so we use set_geometry instead:
    for g, geo in enumerate(gd.geometry):
        # we don't want more than one label per level
        label = 'Level {:02d}'.format(i+1) if g == 0 else None
        sm.set_geometry(geo, facecolor=cmap(i/(len(gds)-1)),
                        alpha=0.8, label=label)

# Get the polygon of the last sink (i.e. the lake) and plot it
gds_0 = gdf.loc[gdf.HYBAS_ID == gdf.iloc[0].MAIN_BAS]
sm.set_shapefile(gds_0, linewidth=2)
# Compute the outline of the entire basin and plot it
gds_1 = gdf.geometry.unary_union
sm.set_geometry(gds_1, linewidth=4)

# plot!
f, ax = plt.subplots(figsize=(6, 4))
ax.set_position([0.05, 0.06, 0.7, 0.9])
sm.visualize(ax=ax)
plt.legend(loc='center left', bbox_to_anchor=(1, 0.5))
plt.show()
Total running time of the script: ( 0 minutes 5.089 seconds)