Note
Click here to download the full example code
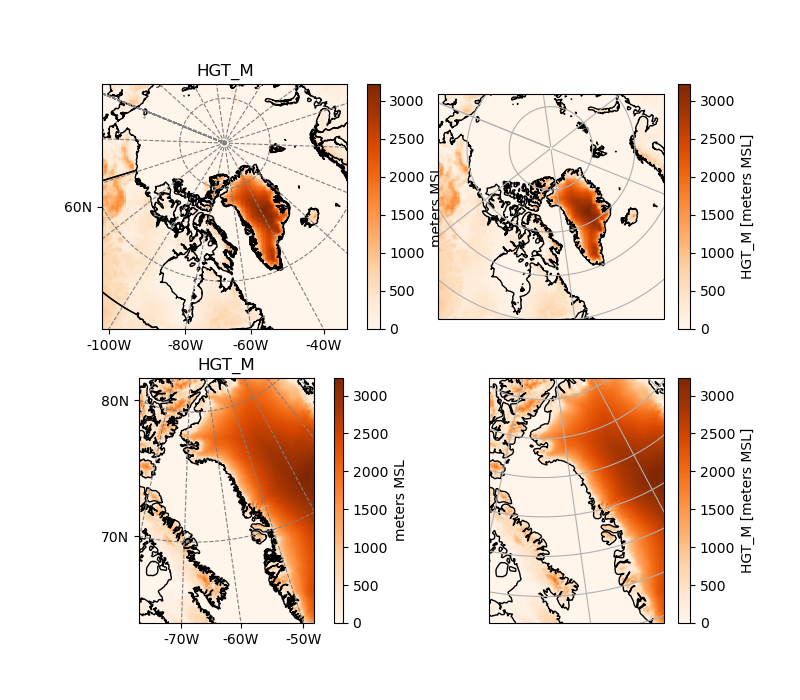
Polar stereographic projections
This example illustrates that salem graphics have a small issue at the pole and proposes an alternative based on cartopy.
The only problem at the pole is the plotting of the longitude contours. There is probably no easy way so solve this problem in salem, hence the suggestion to use cartopy in this case. Note that if the pole isn’t in the domain, salem works just fine.
from salem import open_xr_dataset, get_demo_file
import matplotlib.pyplot as plt

# prepare the figure
f = plt.figure(figsize=(8, 7))

# WRF polar file(s)
d1 = open_xr_dataset(get_demo_file('geo_em_d01_polarstereo.nc'))
d2 = open_xr_dataset(get_demo_file('geo_em_d02_polarstereo.nc'))

# Plot with salem
ax = plt.subplot(2, 2, 1)
d1.HGT_M.salem.quick_map(ax=ax, cmap='Oranges')
ax = plt.subplot(2, 2, 3)
d2.HGT_M.salem.quick_map(ax=ax, cmap='Oranges')

# Now with cartopy
proj = d1.salem.cartopy()
ax = plt.subplot(2, 2, 2, projection=proj)
ax.coastlines()
ax.gridlines()
d1.HGT_M.plot(ax=ax, transform=proj, cmap='Oranges')
ax.set_extent(d1.salem.grid.extent, crs=proj)

# D2 can use a higher resolution coastline
proj = d2.salem.cartopy()
ax = plt.subplot(2, 2, 4, projection=proj)
ax.coastlines(resolution='50m')
ax.gridlines()
d2.HGT_M.plot(ax=ax, transform=proj, cmap='Oranges')
ax.set_extent(d2.salem.grid.extent, crs=proj)

plt.show()
Total running time of the script: ( 0 minutes 20.072 seconds)