Note
Click here to download the full example code
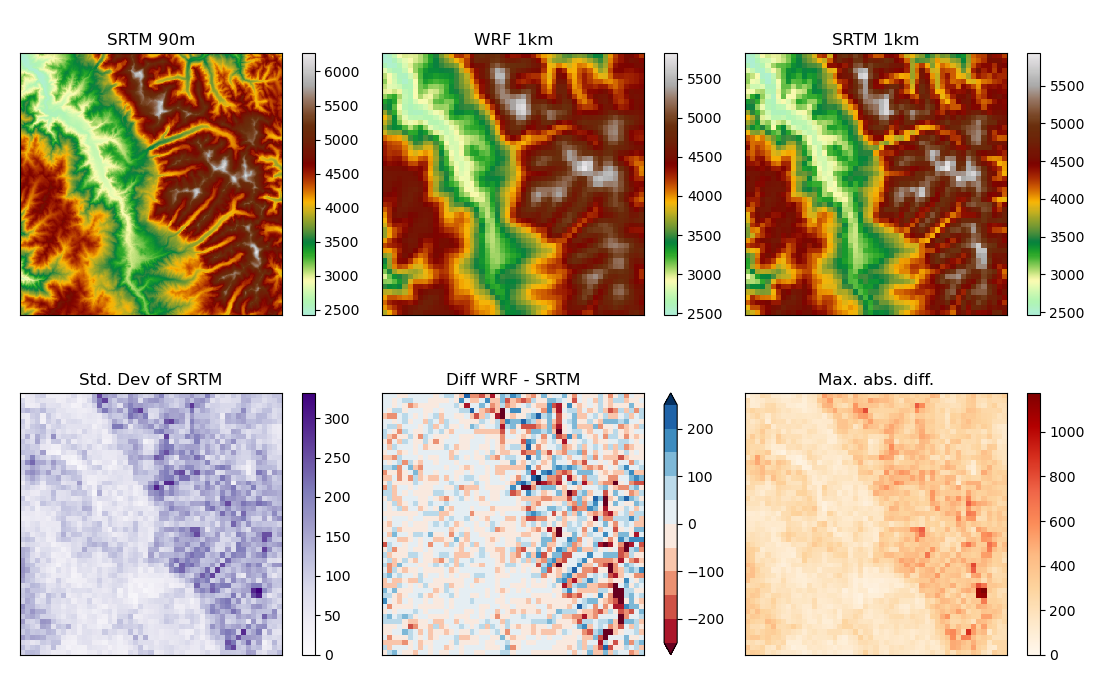
Compare datasets of different resolution
An example of use for salem’s lookup_transform
In this example, we compare a model topography defined at 1km resolution with
the topography from the SRTM v4.1 dataset (resolution 3 minutes of arc,
so ~ 90m). For this we use the DataArrayAccessor.lookup_transform()
method.
From the plot below, we see that the model topography is smoother than the aggregated SRTM (this is a good thing, as atmospheric models do not like steep gradients too much). The highest peaks or lowest valley aren’t resolved by the 1km topography.
import numpy as np
from salem import get_demo_file, open_xr_dataset
import matplotlib.pyplot as plt

# get the topography data
srtm = open_xr_dataset(get_demo_file('riosan_srtm_hgt.nc')).srtm
wrf = open_xr_dataset(get_demo_file('riosan_wrf_hgt.nc')).HGT

# transform the high-res topography onto the coarse grid
# we ask for the lookup table to speed up the second transform
srtm_on_wrf, lut = wrf.salem.lookup_transform(srtm, return_lut=True)
srtm_on_wrf_std = wrf.salem.lookup_transform(srtm, method=np.std, lut=lut)

# for fun we compute the max and min for each grid point
srtm_on_wrf_min = wrf.salem.lookup_transform(srtm, method=np.min, lut=lut)
srtm_on_wrf_max = wrf.salem.lookup_transform(srtm, method=np.max, lut=lut)
# then compute the max absolute difference to wrf
absdif = np.abs(np.dstack([srtm_on_wrf_min - wrf, srtm_on_wrf_max - wrf]))
maxabsdif = np.max(absdif, axis=2)

# Get the map defined by the WRF grid
sm = wrf.salem.get_map(cmap='topo')
# remove the lon-lat ticks for clarity
sm.set_lonlat_contours(interval=0)

# prepare the figure and plot
f, ((ax1, ax2, ax3), (ax4, ax5, ax6)) = plt.subplots(2, 3, figsize=(11, 7))
# absolute values
sm.set_data(srtm)
sm.visualize(ax=ax1, title='SRTM 90m')
sm.set_data(wrf)
sm.visualize(ax=ax2, title='WRF 1km')
sm.set_data(srtm_on_wrf)
sm.visualize(ax=ax3, title='SRTM 1km')
# comparisons
sm.set_data(srtm_on_wrf_std)
sm.set_plot_params(vmin=0, cmap='Purples')
sm.visualize(ax=ax4, title='Std. Dev of SRTM')
sm.set_data(wrf - srtm_on_wrf)
sm.set_plot_params(levels=np.linspace(-250, 250, 11), cmap='RdBu')
sm.visualize(ax=ax5, title='Diff WRF - SRTM')
sm.set_data(maxabsdif)
sm.set_plot_params(vmin=0, cmap='OrRd')
sm.visualize(ax=ax6, title='Max. abs. diff.')

# make it nice
plt.tight_layout()
plt.show()
Total running time of the script: ( 0 minutes 1.874 seconds)